Data View provides valuable insights and helps make informed decisions about your sales efforts. It allows users to quickly view aggregate metrics about their book of business and/or their team.
Some examples of ways to use Data View include lassoing a set of pins on the map to see the annual revenue of those accounts on a per-team or per-user breakdown or identifying how many records in a certain Group were sourced from CRM vs. the MMC Lead Finder tool.
Data View can be accessed via the lasso tool on the Map, Groups View, List View, and Territories View.
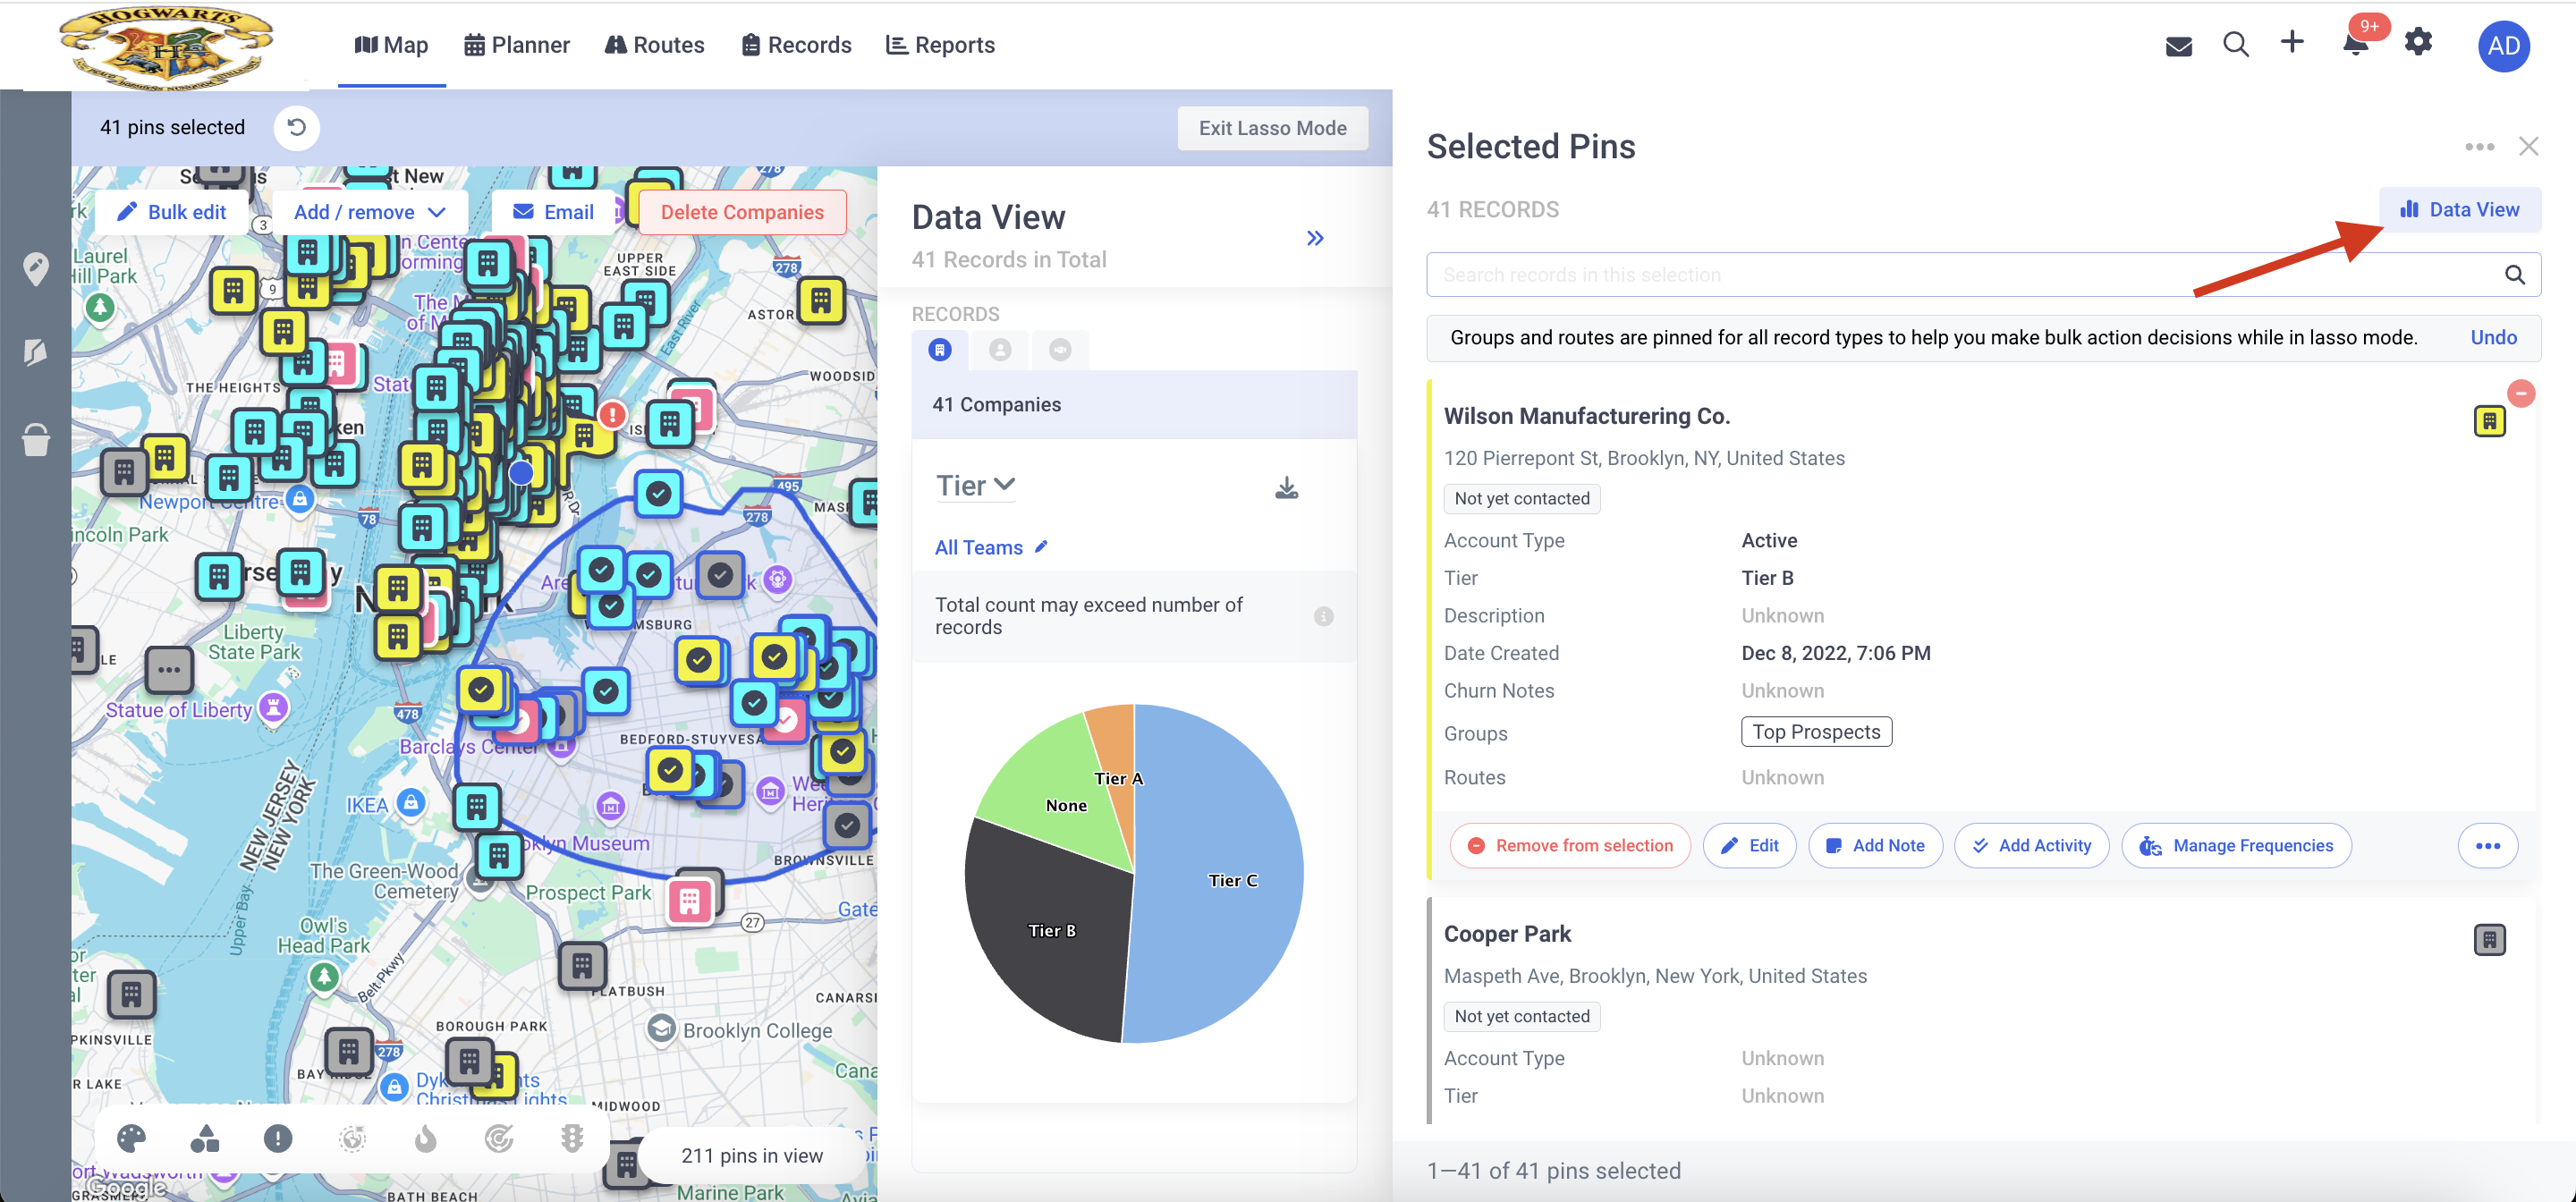
To access Data View via the lasso tool:
- Go to “Map” at the top navigation bar
- Use the Lasso Tool on the right-hand side of the Map and circle a group of pins
- Click on “Data View” from the Open list panel
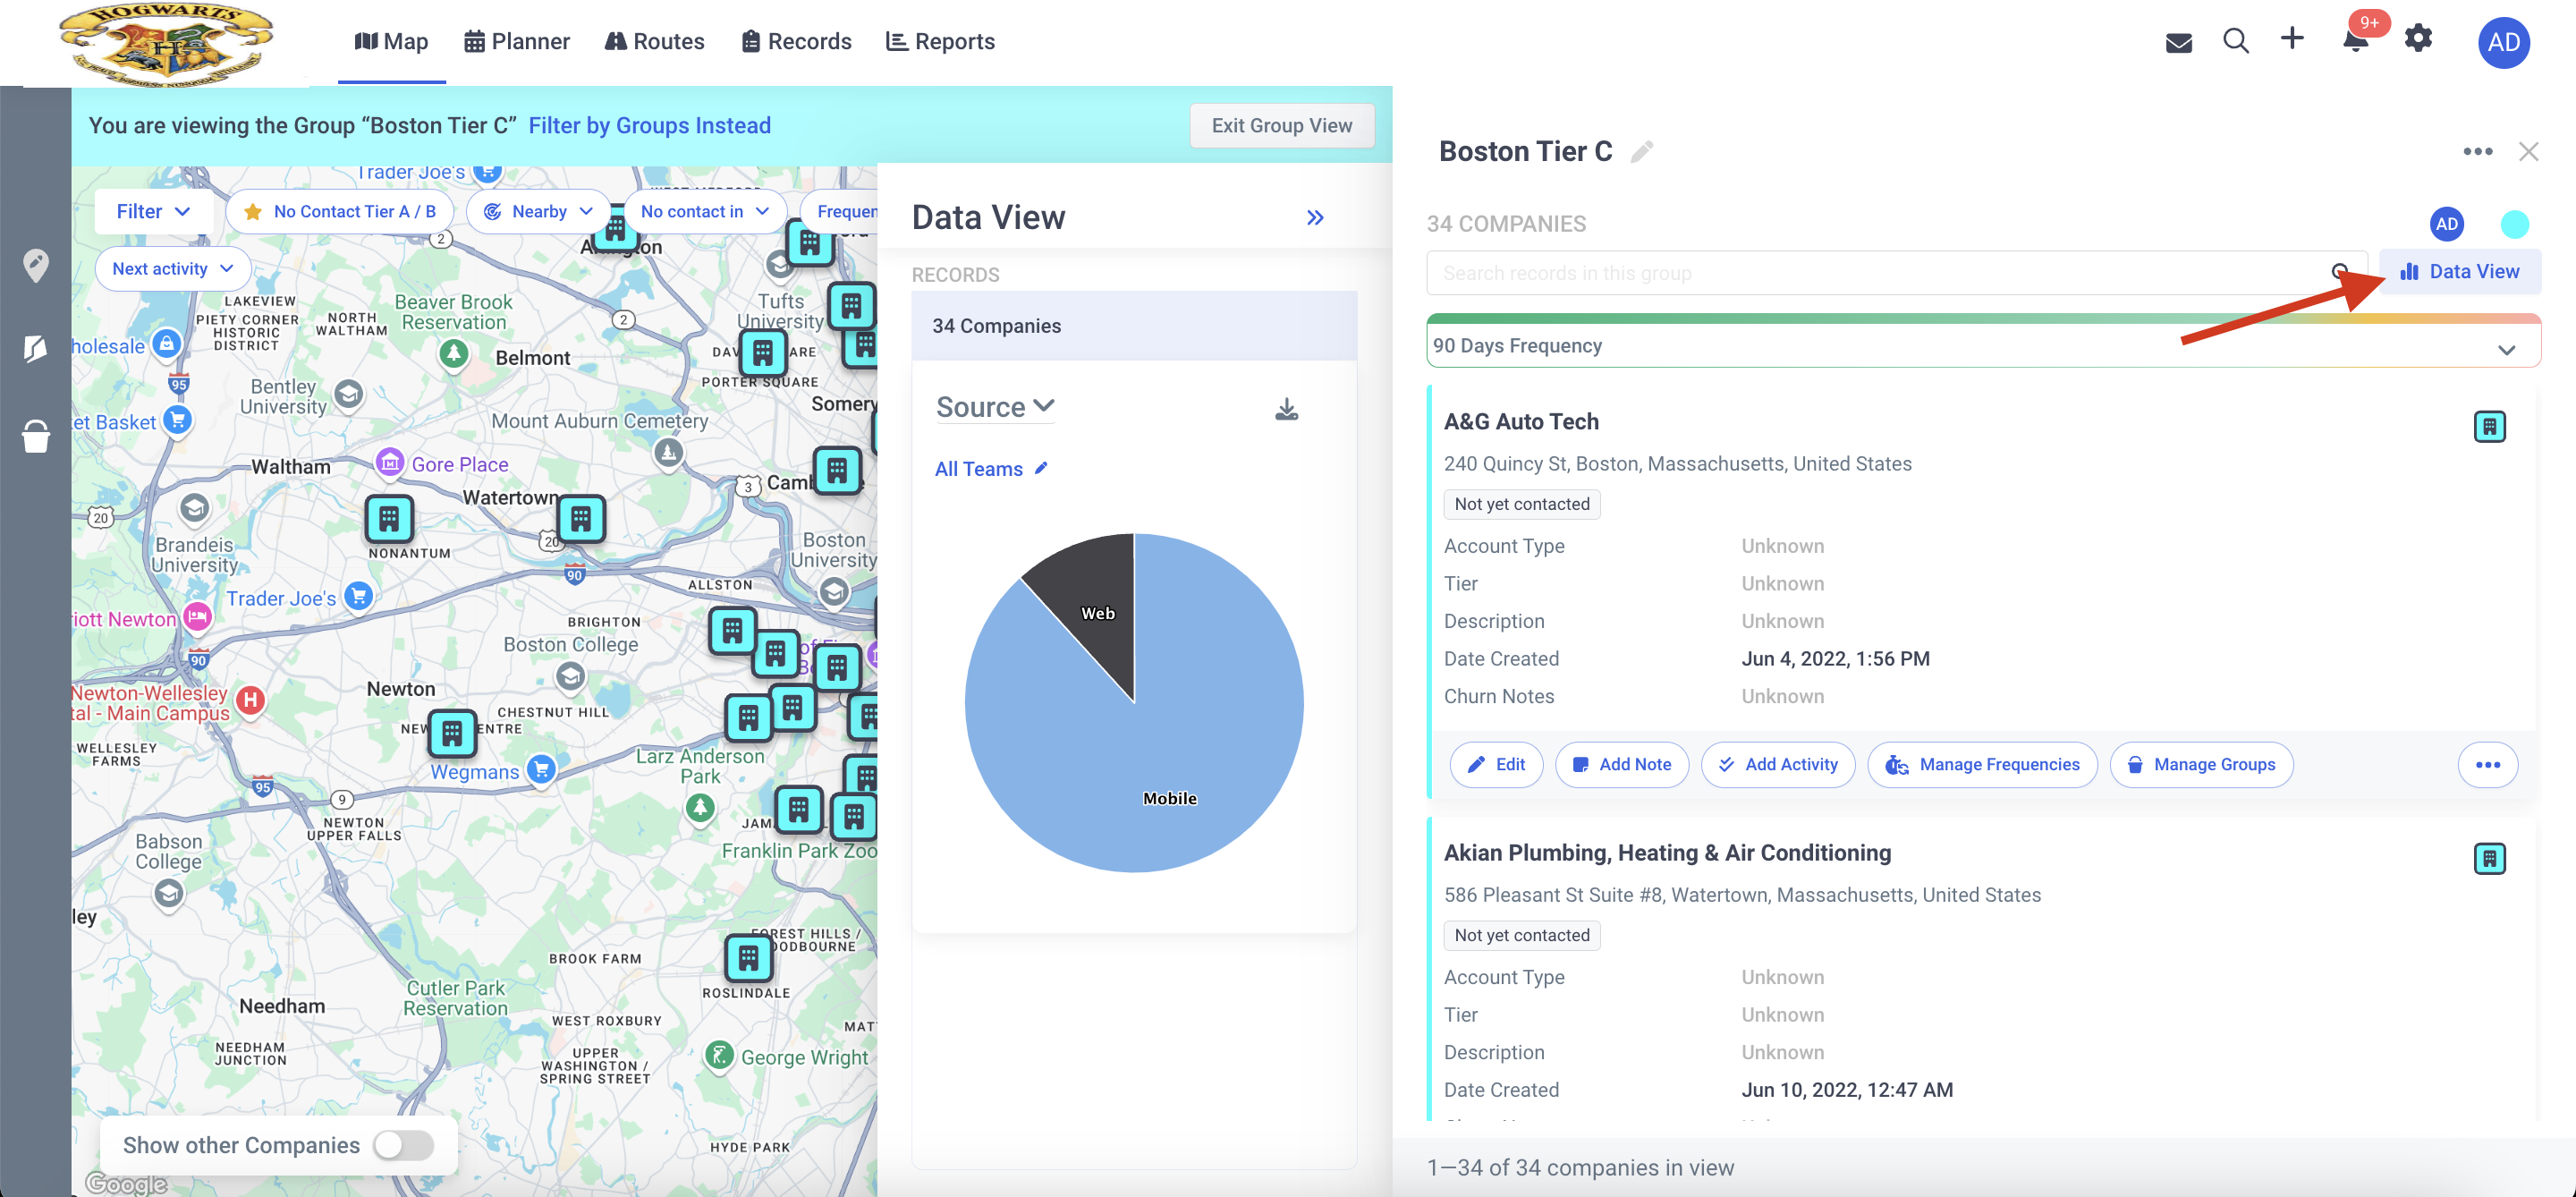
To access Data view via Groups:
- Go to “Map” at the top navigation bar
- Click on “Groups” from the left-hand side toolbar
- Select the Group you would like to view
To access Data view via Territories:
- Go to “Map” at the top navigation bar
- Click on “Territories” from the left-hand side toolbar
- Select the Territory you would like to view
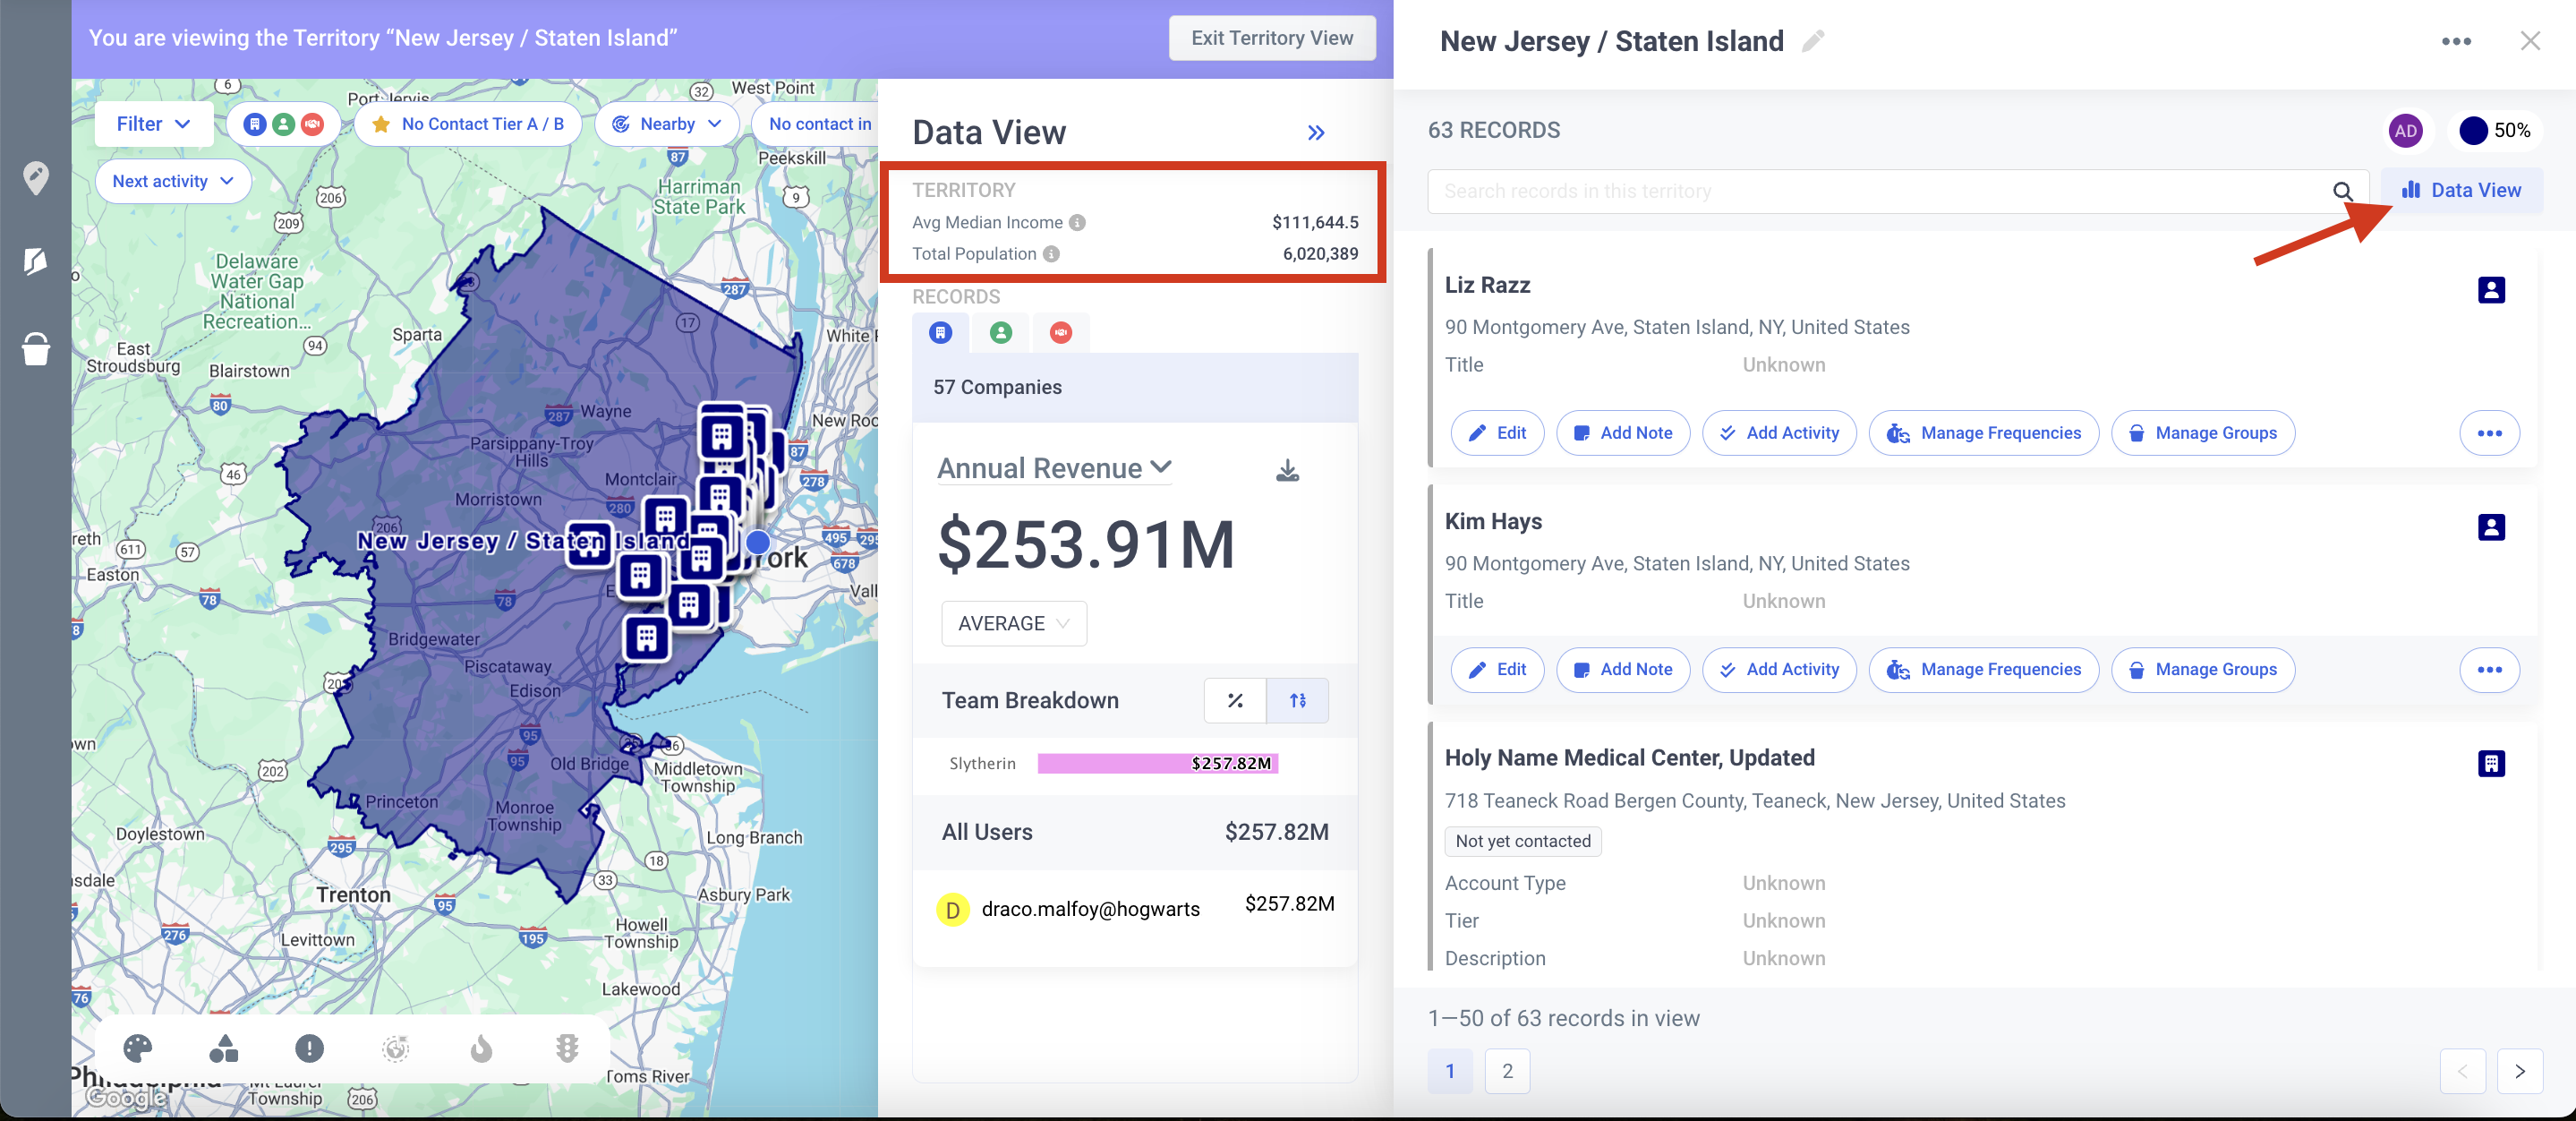
Note: Within the Data View of a Smart Builder Territory - you are also able to access information such as Ave. Median Income and Total Population based on the Demographic Data Layers information relevant to this Territory
To access Data view via List view:
- Go to “Records” at the top navigation bar
- Select multiple records
- Click on “Data view” at the top
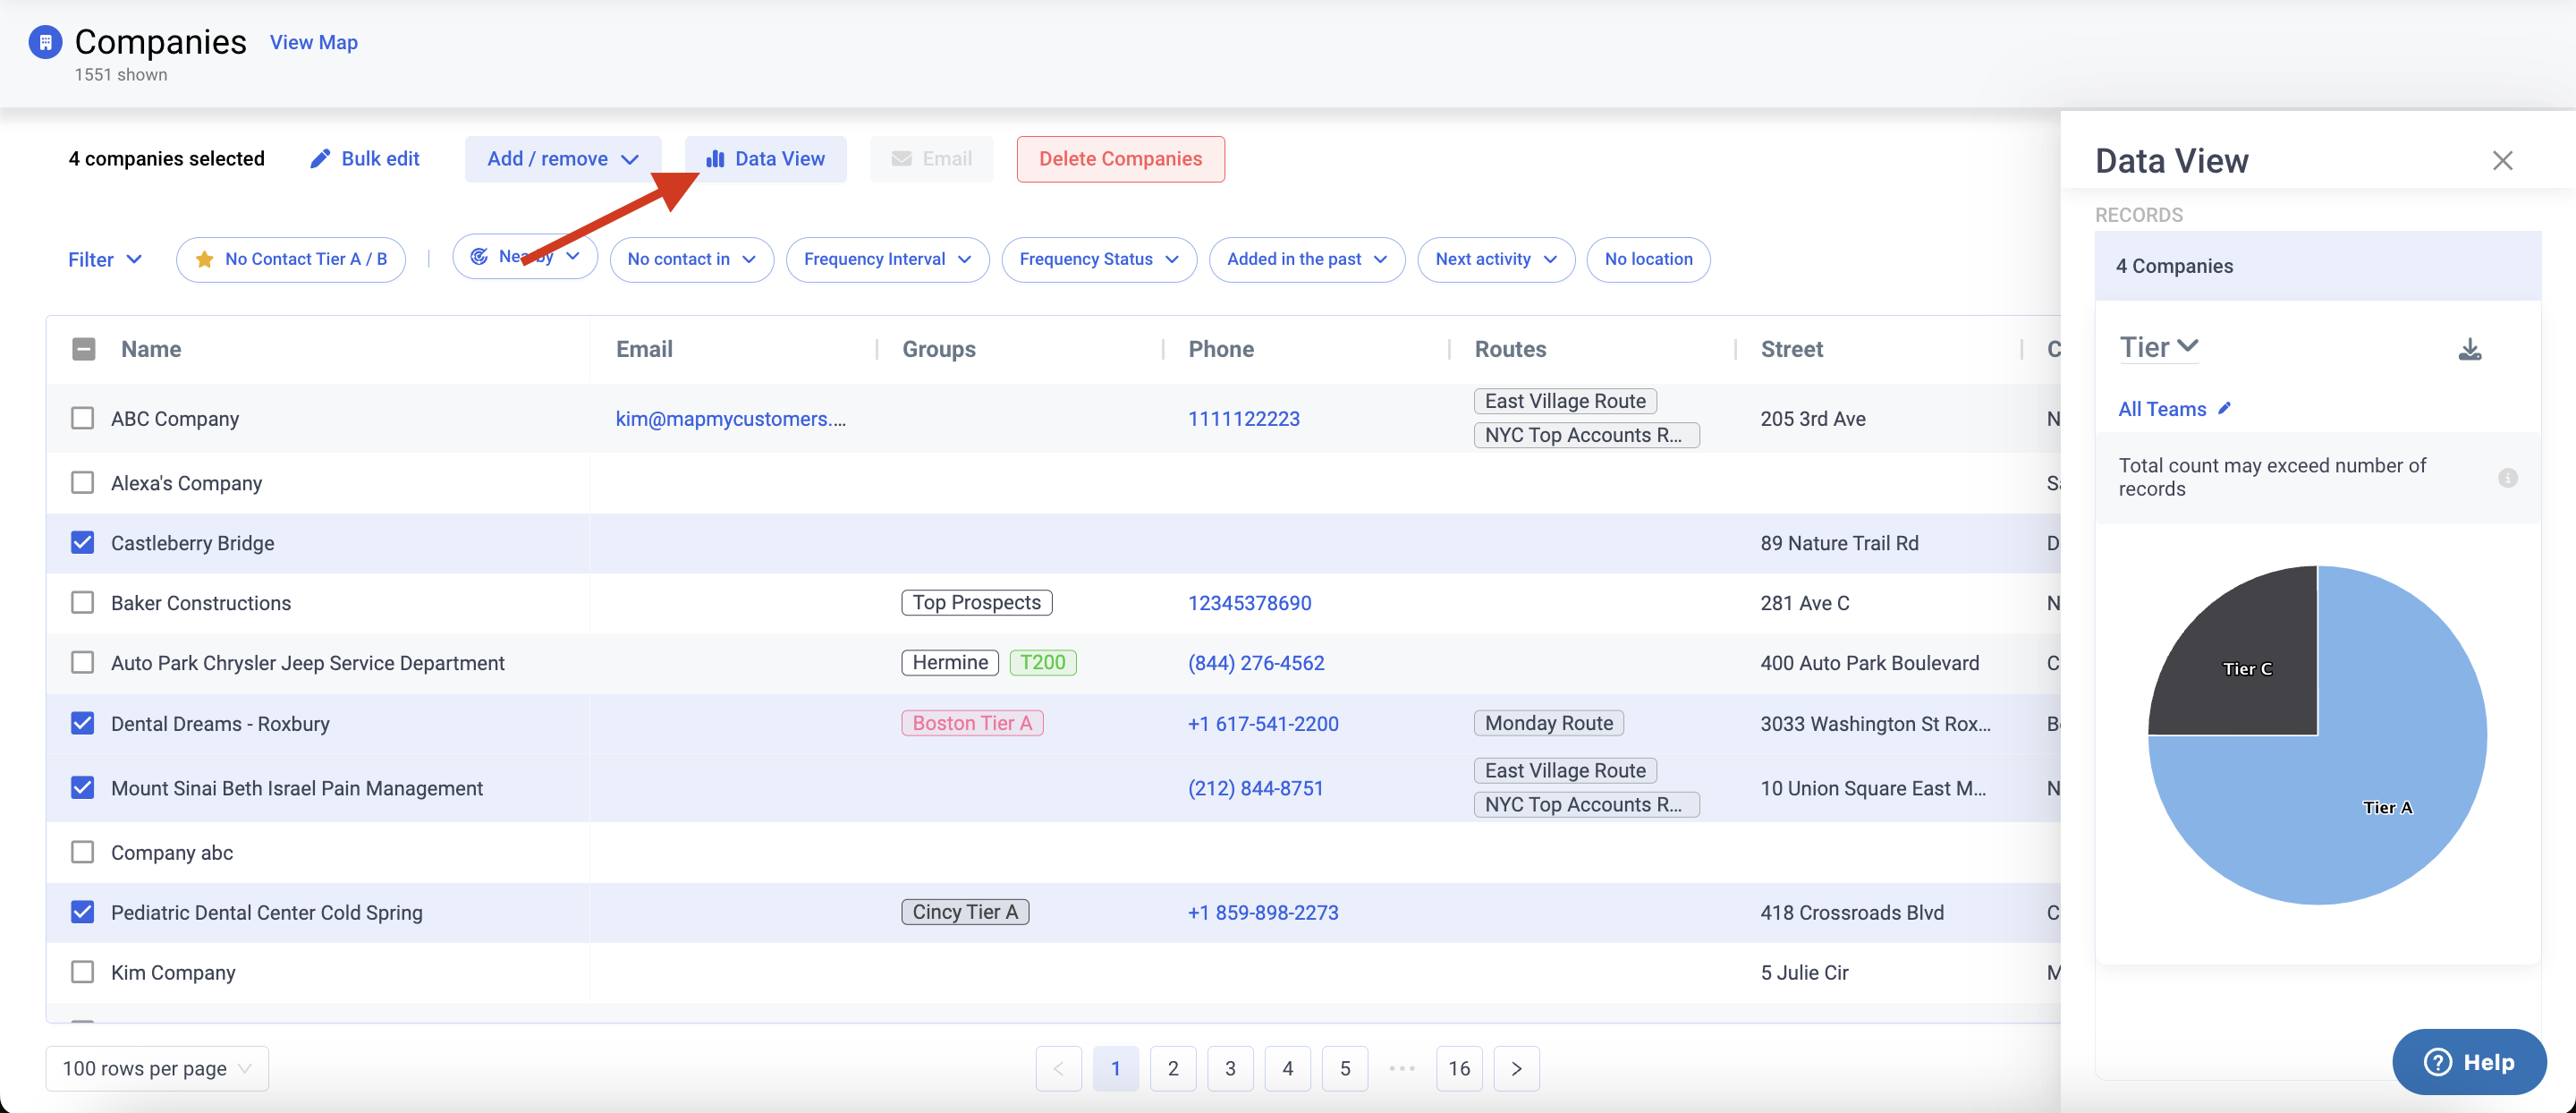
Using Data View
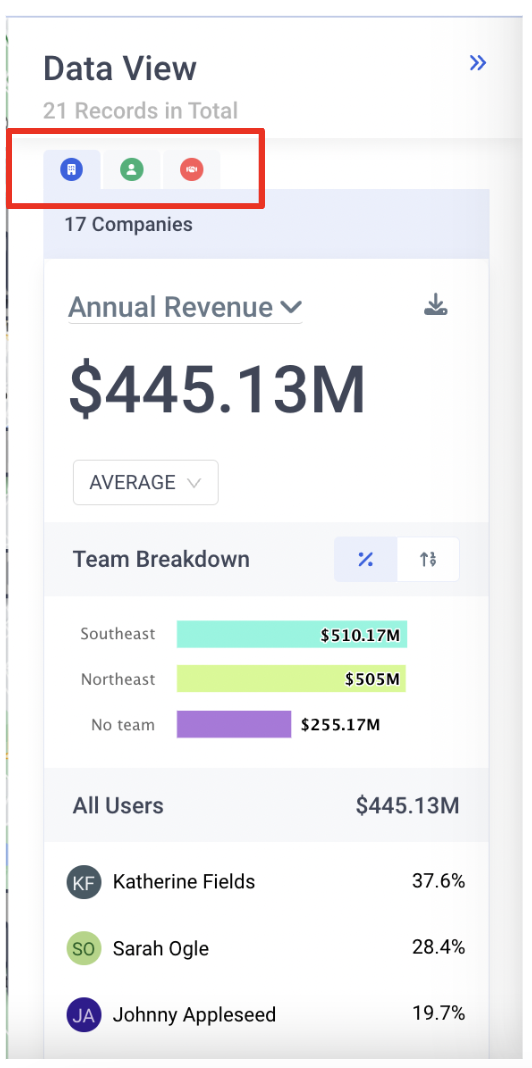
- After you click on "Data View”, you will need to select the entity you want to see metrics for - Companies, People, or Deals.
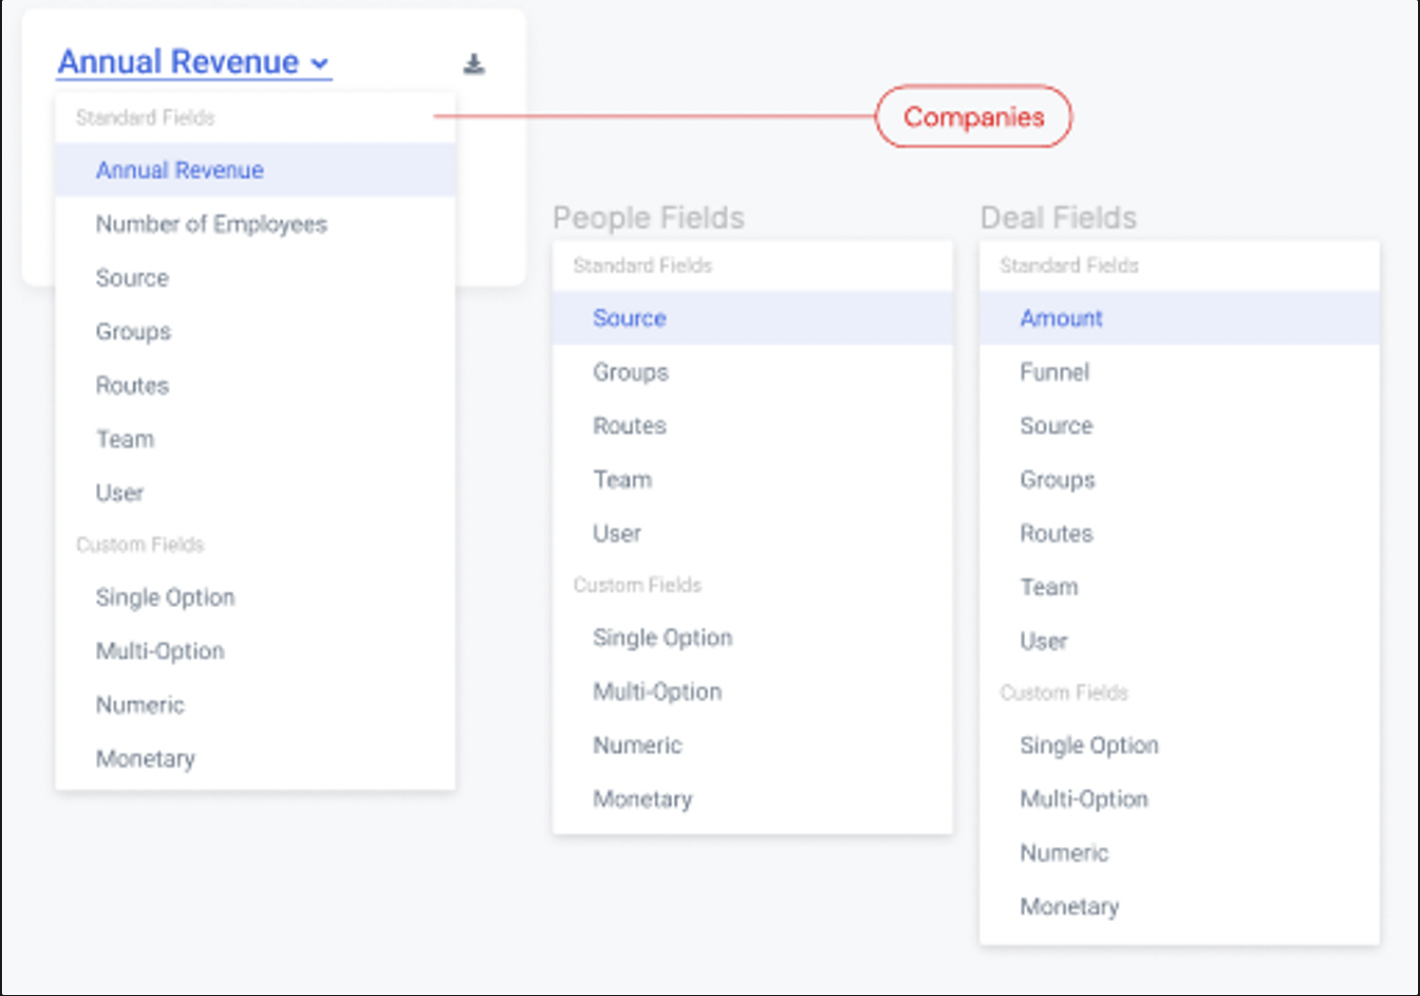
- Select the field you want to track. Below you will see a list of all supported fields by entity type
To export data using Data View:
- Click on the “Download” arrow at the top
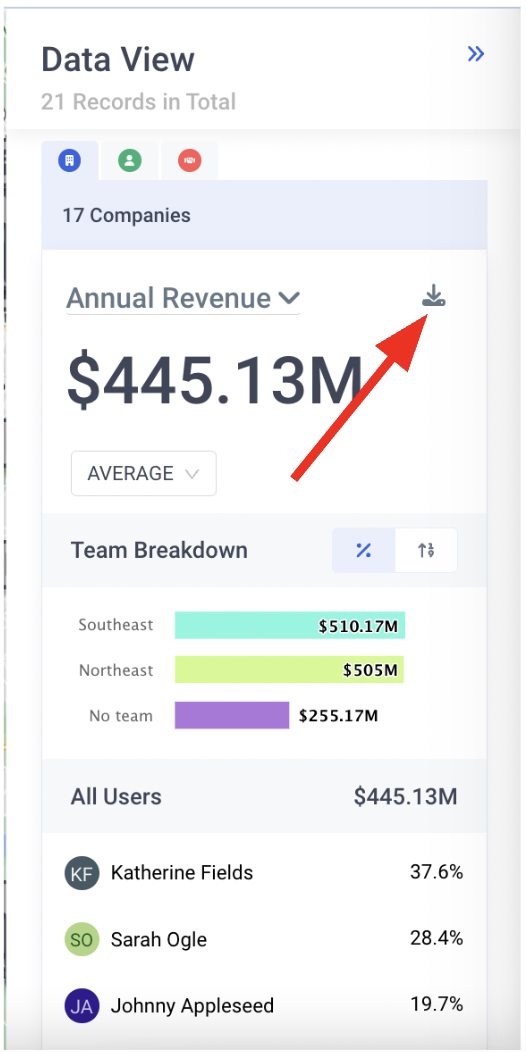
- Wait for the download to complete
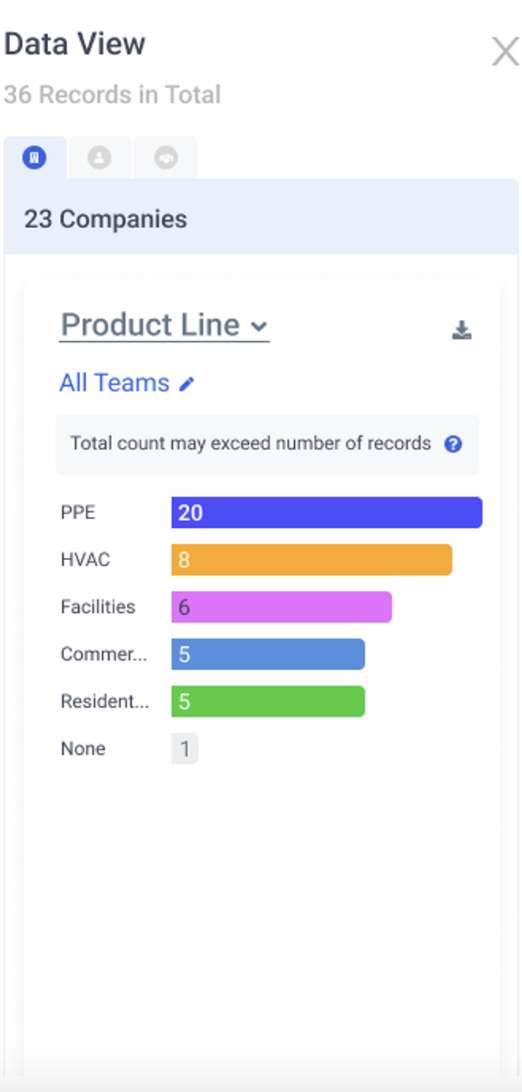
Data View for Multi-Option, Single-Option Fields, or Groups / Routes
Multi-option/single-option fields (e.g. groups, source, etc.) will show a visual breakdown of the COUNT of records that hold each value.
Users can opt to filter by Teams or Users.
The chart will display as a bar chart unless there are five or fewer unique values.
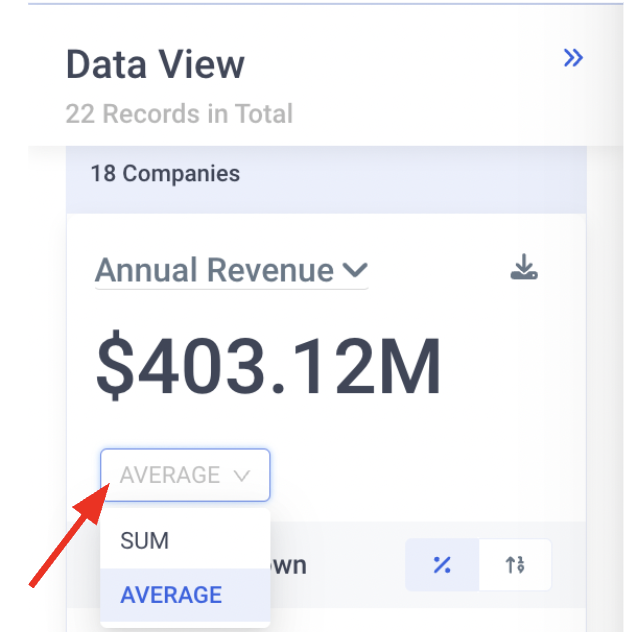
Data view for Numeric or Monetary Fields
Examples: Annual Revenue, Number of Employees
The large number at the top of the panel will represent one of the following
- SUM of all values in selection
- AVERAGE of all values in selection
Below that, a Breakdown by Team and Users within the Team or Teams is highlighted.
- Teams will display as a bar chart unless there are five or fewer teams. Then, they will display as a Donut chart.
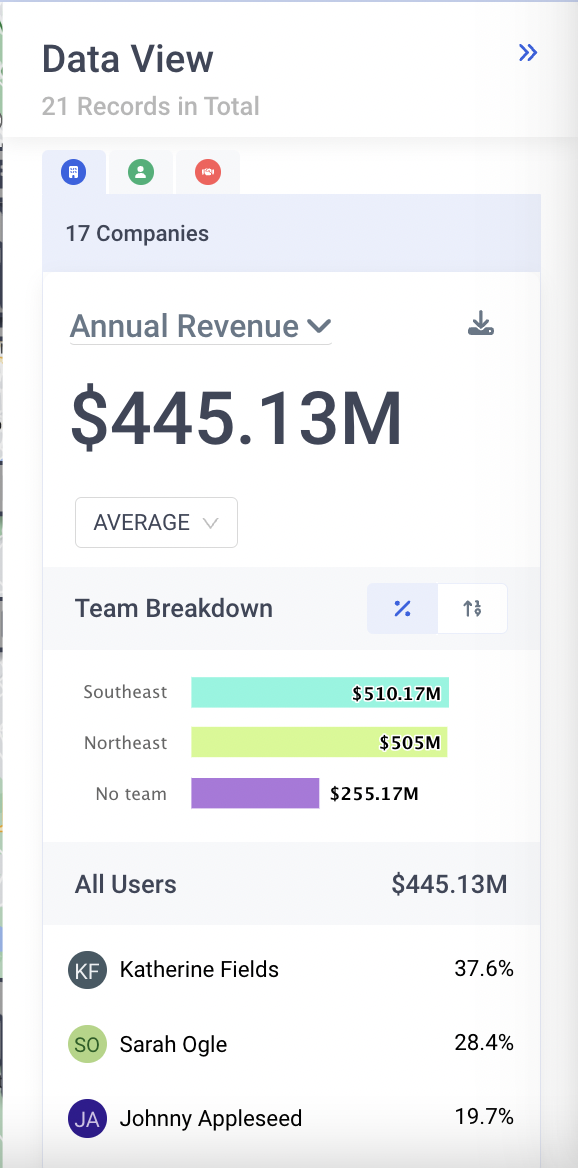
Here you can also select:
- Whether you want to see gross counts or percentages %’s
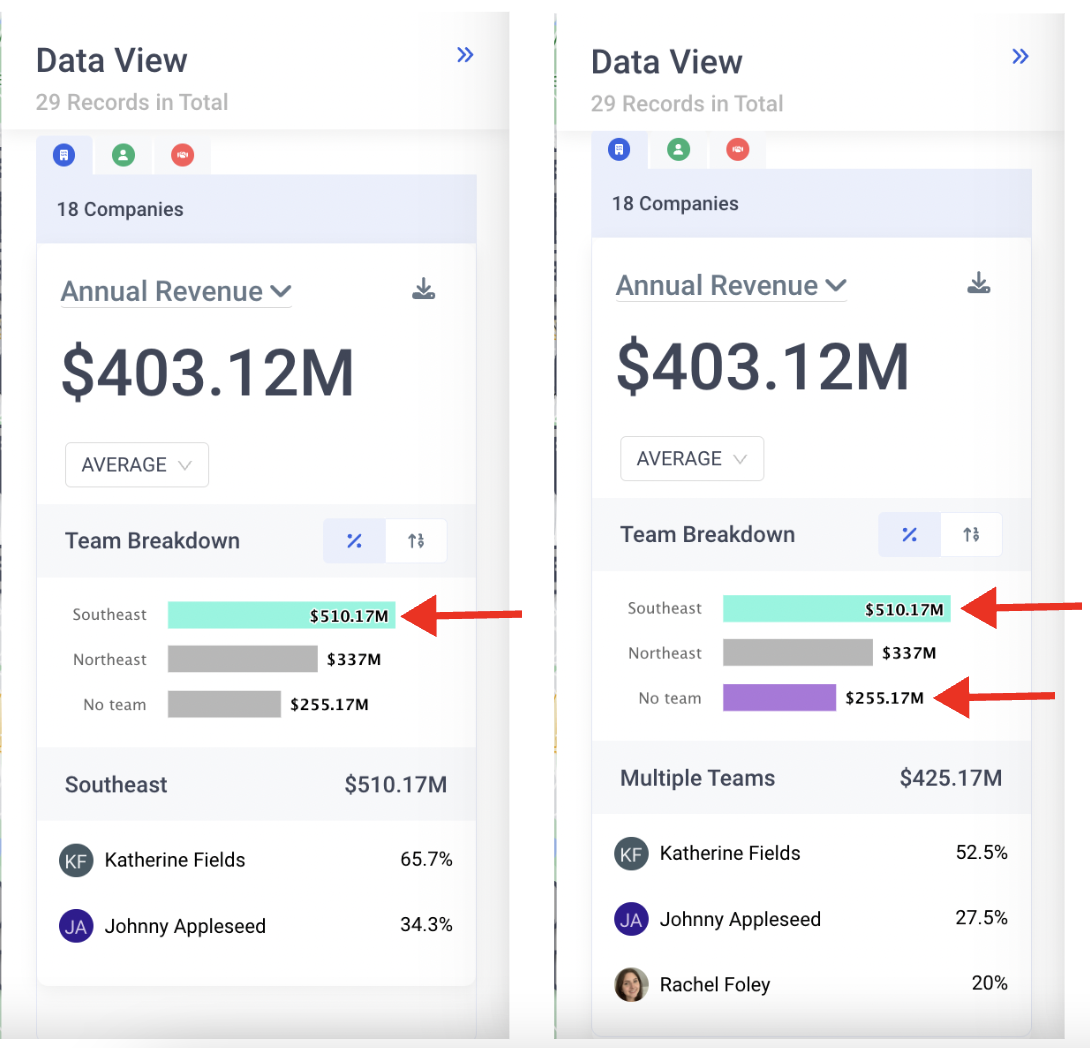
When viewing numeric aggregations, users can select one or multiple teams at a time to see the full list of users in those teams and how they compare.
Data View for Funnels and Stages
Funnel and Stage View have a unique interface. Selected deals are broken up by Funnel in the top chart, and the lower list breaks this down further by stage.
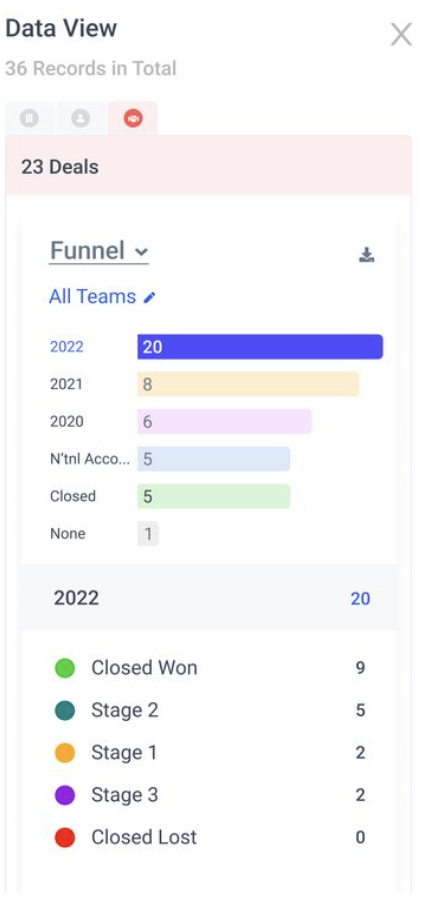
You can click on each funnel’s chart to review the stages summary below